


GE McKinsey Matrix: Easily prioritize investments among your Business Units or Products with our Template and Guide

Description
The GE-McKinsey Matrix is a portfolio management tool that helps corporations prioritize investments among their business units. It provides guidance on whether to invest, protect, harvest, or divest from a business unit based on its market attractiveness and competitive strength. The matrix is useful for corporations with a large portfolio of strategic business units.
The GE-McKinsey Matrix was developed in the 1970s by General Electric in collaboration with McKinsey & Company. The matrix compares groups of products with their competitive power and market attractiveness. The portfolios themselves are comprised of the full suite of products or services that a business offers to the market. The matrix allows a large, decentralized company to determine where best to invest its cash by judging each strategic business unit according to whether it will do well in the future. The GE-McKinsey Matrix is fundamentally a portfolio analysis that helps corporations make strategic decisions on a corporate level.

Step-by-step tutorial on how to use the GE-McKinsey Matrix
Step 1: Identify the strategic business units (SBUs) that you want to analyze:

Step 2: Determine the industry attractiveness of each SBU using factors such as market size and market growth :

Step 3: Determine the competitive strength of each SBU using factors such as market share and manufacturing capacity:

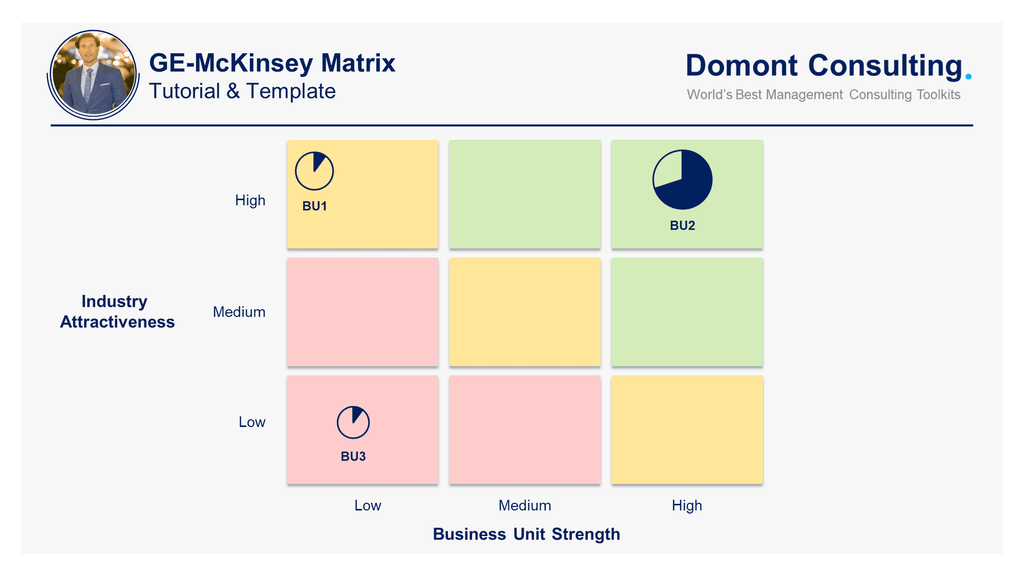
Step 4: Plot each SBU on the matrix based on its industry attractiveness and competitive strength:

Step 5: Determine the appropriate strategy for each SBU based on its position on the matrix:
Strategic Business Units (SBUs) in the top left corner (green squares) have a relatively strong position in an attractive industry. This indicates that it's a good idea to invest in these. Look for growth opportunities, and build on current strengths to improve your position in the market.
SBUs in the middle (orange squares) are average. Some might have a good position in a slower industry, or they might have a weak position in a good market, but there's something positive that you can develop within these business units. You could consider investing more resources, defending your current position, or attempting to find a niche, for example.
SBUs in the bottom right corner (red squares) are in an unattractive industry, a weak position, or both. There are no promising scenarios, so it's probably best to look at exit strategies. It would be unwise to invest any further in these business units, and it would make more sense to reallocate resources to units in other parts of your Matrix.

Step 6: Monitor and adjust your portfolio of SBUs over time to ensure that it remains aligned with your corporate strategy:
This step is critical because the market and competitive landscape are constantly changing, and what was once a high-growth, high-profit SBU may become a low-growth, low-profit SBU over time. By monitoring your portfolio of SBUs, you can identify which ones are underperforming and take corrective action, such as divesting or investing in them.
Adjusting your portfolio of SBUs can also involve mergers and acquisitions, which can help you enter new markets or strengthen your competitive position. The key is to ensure that your portfolio of SBUs is always aligned with your overall corporate strategy and that you are investing your cash in the right places to maximize long-term value for your shareholders.
Download our Tutorial and Template using a computer:
Need more help? Check our Toolkits:
- Corporate and Business Strategy Toolkit
- Management Consulting Toolkit
- Mergers & Acquisitions Toolkit
