


Identify the root causes of a problem with our Fishbone diagram template in Powerpoint

Fishbone Diagram Tool Description
The Fishbone diagram, also known as the Ishikawa diagram or cause-and-effect diagram, is a tool used to identify the root causes of a problem. It was developed by Japanese quality control expert Kaoru Ishikawa in the 1960s. The Fishbone diagram is considered one of the seven basic quality tools and is widely used in industries such as manufacturing, healthcare, and software development.
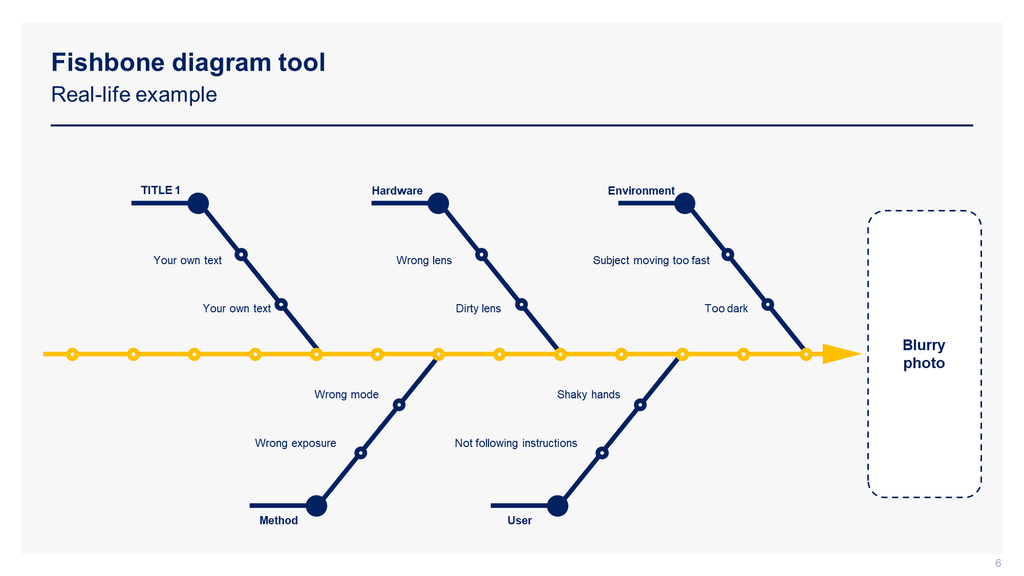
The Fishbone diagram is a visual representation of the factors that contribute to a single problem. It helps break down, in successive layers, root causes that potentially contribute to an effect. The diagram is shaped like a fish's skeleton, with the problem statement written at the head of the fish and the contributing factors branching out from the spine. The Fishbone diagram can be used to structure a brainstorming session and immediately sorts ideas into useful categories.
To use the Fishbone diagram, start by agreeing on a problem statement (effect) and writing it at the center right of a flipchart or whiteboard. Draw a box around it and draw a horizontal arrow running to it. Brainstorm the major categories of causes of the problem. If this is difficult, use generic headings such as Methods, Machines (equipment), People (manpower), Materials, and Environment. Write the categories of causes as branches from the main arrow. Brainstorm all possible causes of the problem and ask "Why does this happen?" As each idea is given, write it as a branch from the appropriate category. Causes can be written in several places if they relate to several categories. Again ask "Why does this happen?" about each cause and write sub-causes branching off the causes. Continue to ask "Why?" and generate deeper levels of causes. Layers of branches indicate causal relationships.
The Fishbone diagram can help identify many possible causes for an effect or problem and can be used to develop effective solutions.
Click on the image below to download our Fishbone Diagram Templates in Powerpoint:

