Prioritize your businesses/products with the BCG Growth-Share Matrix (includes a PPT template)

Description
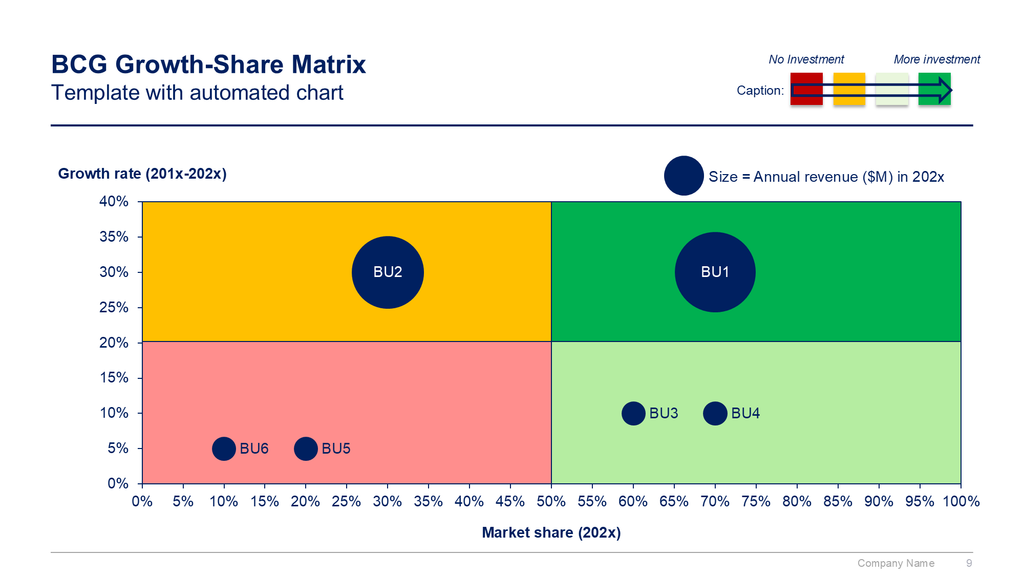
The BCG Growth-Share Matrix, also known as the Boston Consulting Group Matrix, is a portfolio management tool that helps companies decide how to prioritize their different businesses. The matrix is split into four quadrants, each with its own unique symbol that represents a certain degree of profitability: question marks, stars, pets (often represented by a dog), and cash cows. By assigning each business to one of these four categories, executives could then decide where to focus their resources and capital to generate the most value, as well as where to cut their losses.
The matrix was created in 1968 by Bruce Henderson, the founder of BCG. It was built on the logic that market leadership results in sustainable superior returns. Ultimately, the market leader obtains a self-reinforcing cost advantage that competitors find difficult to replicate. These high growth rates then signal which markets have the most growth potential.
Each of the four quadrants represents a specific combination of relative market share and market growth rate:
-Low Growth, High Share: Companies should milk these “cash cows” for cash to reinvest.
-High Growth, High Share: Companies should significantly invest in these “stars” as they have high future potential.
-High Growth, Low Share: Companies should invest in or discard these “question marks,” depending on their chances of becoming stars.
-Low Share, Low Growth: Companies should liquidate, divest, or reposition these “pets.”
The matrix reveals two factors that companies should consider when deciding where to invest: company competitiveness and market attractiveness, with relative market share and growth rate as the underlying drivers of these factors.
The BCG Growth-Share Matrix is still central in business school teachings on business strategy and has been used by about half of all Fortune 500 companies.
Step-by-step tutorial
- List your products: Start by listing all of your company’s products or services that you want to evaluate.
- Determine the market growth rate: Determine the growth rate of the market in which each product operates.
- Calculate relative market share: Calculate the relative market share of each product by dividing its own market share by the market share of the largest competitor.
- Plot your products on the matrix: Plot each product on the matrix using its relative market share and market growth rate.
- Analyze and prioritize: Analyze each product’s position on the matrix and prioritize your resources accordingly.
Real-life Examples
PepsiCo used the BCG Growth-Share Matrix to analyze its product mix and determine which products to invest in and which to divest. The company identified its Frito-Lay brand as a cash cow with a US market share of 58.8%. This meant that Frito-Lay was generating significant cash flows for the company, but had limited growth potential. PepsiCo decided to continue investing in Frito-Lay to maintain its market position and generate cash, while also investing in other products with higher growth potential.
Apple has used the BCG Growth-Share Matrix to analyze its product portfolio and determine which products to invest in and which to divest. The company identified its iPhone as a star with high growth potential, while its Macbook was identified as a cash cow with limited growth potential. This meant that Apple continued to invest heavily in the iPhone while maintaining its position in the laptop market with the Macbook.
A product in the dog quadrant has a low market share and operates in a low-growth market. Dogs are often referred to as “cash traps” because they require significant amounts of cash to maintain their market position, but generate little cash in return. An example of a company with a product in this quadrant is Sony’s VAIO laptops. The VAIO laptops had a low market share and were not generating significant cash flows for Sony.
A product in the question mark quadrant has a low market share but operates in a high-growth market. Question marks are also known as “problem children” because they require significant amounts of cash to maintain their market position and have an uncertain future. An example of a company with a product in this quadrant is Tesla’s energy storage business. Tesla’s energy storage business has a low market share but operates in a high-growth market, which means that it has the potential to become a star if Tesla invests in it.
Download our Guide and Template using a computer:
Need more help? Check our Toolkits:
- Corporate/Business Strategy and Strategic Planning Toolkit
- Sales, Marketing & Communication Strategy Toolkit
- Management Consulting Toolkit


